Nike Earnings Preview: What the Charts Say Ahead of the Q3 Report
Nike will report earnings on Tuesday after the close. Here are the must-know levels after the quarterly results come out.
Nike will report earnings on Tuesday after the close. Here are the must-know levels after the quarterly results come out.
Nike (NKE) - Get Free Report will be in focus on Tuesday after the close, as the athletic-apparel retailer gears up to report its fiscal-third-quarter results.
Nike stock had been trading well. From the October low to the 2023 high, the shares rallied 59%. But over the past six weeks, the stock pulled back more than 11%. Is this simple consolidation or a sign of more weakness to come?
That’s tough to say, as retail has been a very mixed bag.
Companies like Target (TGT) - Get Free Report, Costco (COST) - Get Free Report and many others have seen disappointing earnings reactions.
Others, like Ulta Beauty (ULTA) - Get Free Report and Dick’s Sporting Goods (DKS) - Get Free Report, have recently hit all-time highs and have reported strong results.
Don't Miss: Bank Stocks Remain Pressured. XLF Chart Support Is a Line in the Sand.
Given that Nike tends to be in the higher-end and “stickier” part of retail given its customer base — and given the clear momentum we’re seeing in sporting goods via Dick’s — it’s reasonable to have a bullish bias on Nike into the print.
The latest pullback helps cement that belief, as expectations have now come down a bit as well. Let’s look at the chart.
Trading Nike Stock Ahead of Earnings
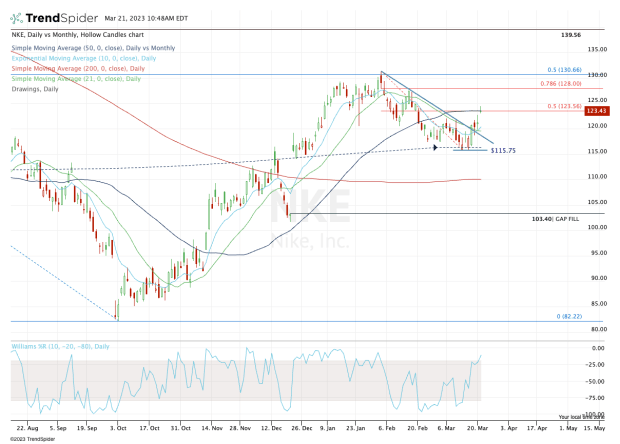
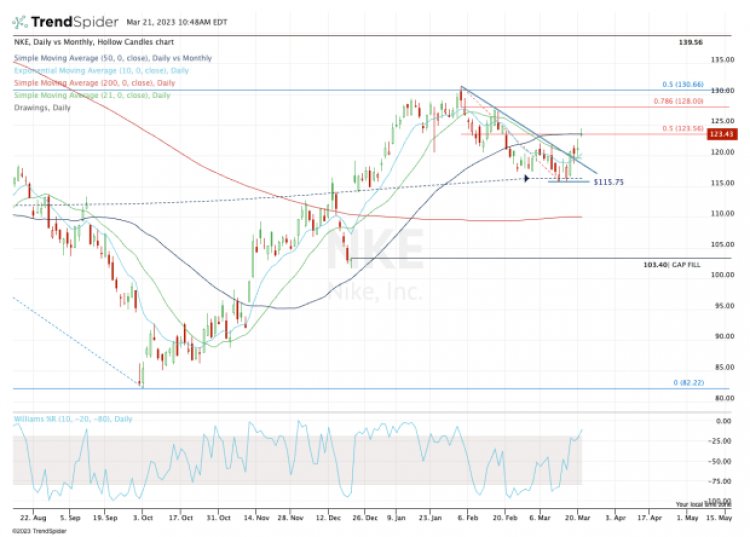
Chart courtesy of TrendSpider.com
Shares of Nike pulled back gradually over a six-week span, coughing up about 11.5% in the process.
The stock ultimately found support at the 50-month moving average and near the $115.75 area.
We’ve seen a pop over the past few days, as the stock broke out over downtrend resistance (blue line) and reclaimed the 10-day and 21-day moving averages.
Now Nike stock is pausing at the 50-day moving average and 50% retracement of the current decline. And we’re at a crossroads.
Don't Miss: Is the Drop in Caterpillar Stock Done? A Look at the Charts
If Nike continues higher, see how it handles the $128 level. Above that opens the door to the recent high at $131.31. Above both levels and Nike could march up to the $138 to $142 zone.
On the downside, the bulls want to see the stock pull back to the $115.75 area and hold there. A move below $115 and a close below $115.75 could open the door down to the 200-day moving average currently near $110.
A painful decline could ultimately set the stage for Nike stock to fill the gap near $103.50.
What's Your Reaction?