How to Calculate Inflation-Adjusted Prices: Formulas & Examples
What Is Inflation-Adjusted Pricing?Inflation can erode the purchasing power of money, but adjusting prices for inflation can indicate how the value of money has changed over time. A million dollars was worth a lot a century ago, and a millionaire would likely have landed in the highest percentile ...
What Is Inflation-Adjusted Pricing?
Inflation can erode the purchasing power of money, but adjusting prices for inflation can indicate how the value of money has changed over time. A million dollars was worth a lot a century ago, and a millionaire would likely have landed in the highest percentile of earners. Nowadays, it would take a billion to be in the top income bracket, and a million just isn’t worth what it was back then because of the rate of inflation over 100 years.
High inflation over time can severely erode the value of money. A large, sudden pick-up in prices from one year to the next, for example, would raise the costs of goods and services, but at the same time, it could benefit borrowers because of the lower value of debt. Calculating prices by adjusting for inflation can also help families with their budgets and investments, and help businesses assess the value of their inventories.
How to Calculate Inflation-Adjusted Prices
To find out how inflation has affected the value of money over time, calculations can be done by hand or using spreadsheets. The U.S. Bureau of Labor Statistics has a website that allows users to calculate how the buying power of money has changed over certain periods due to inflation.
An ideal way to calculate inflation-adjusted prices is by collecting data on a particular indicator, preferably a consumer price index. In the U.S., one of the most widely followed indicators is the Consumer Price Index for All Urban Consumers (CPI-U), which is used in the calculation methods demonstrated in this article. The U.S. Bureau of Labor Statistics compiles the CPI-U on a monthly basis and provides the data on its website.
Manual Calculation
Calculating inflation-adjusted prices by hand involves collecting two pieces of data from the CPI-U. The tables below show how the buying power of $2.50 for a slice of pizza has changed from one year to another year, adjusted for inflation.
Latest Price Formula
To calculate how the value of money has changed from the most recent period to an earlier period, collect the latest inflation index and divide that by the earlier inflation index, and then the price is divided by that quotient. In the table below, the new inflation index is divided by the old inflation index, and that results in a ratio. The price is then divided by the ratio to show how much money had an equivalent amount of purchasing power over time.
(New Inflation Index / Old Inflation Index) / Price
The table below shows the CPI-U data for November in 2022, 2021, 2020, 2010, and 2000. Over time, the buying power of $2.50 in November 2022 drops to $2.33 in November 2021 and to $1.46 in November 2000.
Earliest Price Formula
On the flip side, to calculate how the value of money has changed from an earlier period to the most recent, the formula changes. The old inflation index is divided by the new inflation index, but that quotient (the ratio) is multiplied by the price.
(Old Inflation Index / New Inflation Index) * Price
In the table below, after adjusting for inflation, the purchasing power of $2.50 in November 2000 was $3.14 in November 2010 and $4.28 in November 2000. That showed money in 2000 would have bought almost two slices of pizza in 2022.
Automatic Calculation
The U.S. Bureau of Labor Statistics has a website that automatically calculates the value of a particular item from one period and shows its value in another period. That adjustment for inflation shows the buying power over time between the two periods, as shown in the screengrabs below.
For example, by setting the first time reference at November 2022 and the second time reference at November 2020, the buying power of $100 in 2022 was an inflation-adjusted $87.41 in 2020. Conversely, by switching the input on the time references, the buying power of $100 in November 2020 would have been $114.40 in November 2022, after adjusting for CPI.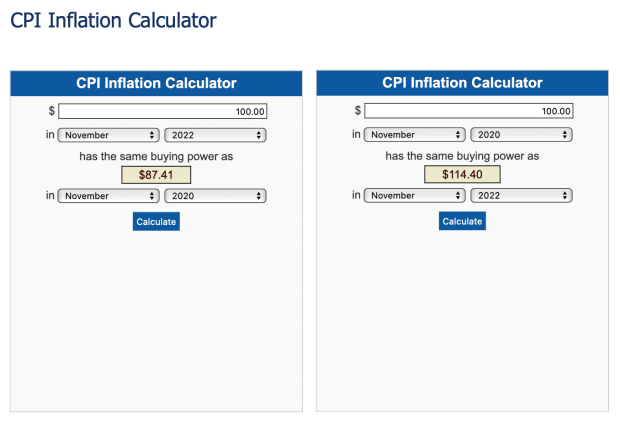
What's Your Reaction?