Regional-Bank Preview: The Technical Setup as Earnings Reports Loom
The Regional Banking ETF still raises concern from a technical-analysis standpoint.
The Regional Banking ETF still raises concern from a technical-analysis standpoint.
The bull rally of 2023 faced a massive test in March and it’s passing -- at least so far.
The S&P 500 was on a tear to start the year, but concern rose quickly given the regional banking crisis. That’s exemplified as SVB Financial (SIVB) - Get Free Report and Signature Bank (SBNY) - Get Free Report failed and as UBS (UBS) - Get Free Report was all but forced to acquire Credit Suisse. (CS) - Get Free Report.
Don't Miss: Time to Own AT&T, Verizon and T-Mobile?
Regional banks have been much weaker than the larger institutional banks, although investors' concerns appear to have eased in the past few weeks.
But since the major banks -- JPMorgan (JPM) - Get Free Report, Citi (C) - Get Free Report and others -- are due to report on Friday and beyond, worries about the regionals could quickly return to the spotlight.
Let’s look at the technical setup for the SPDR S&P Regional Banking ETF (KRE) - Get Free Report.
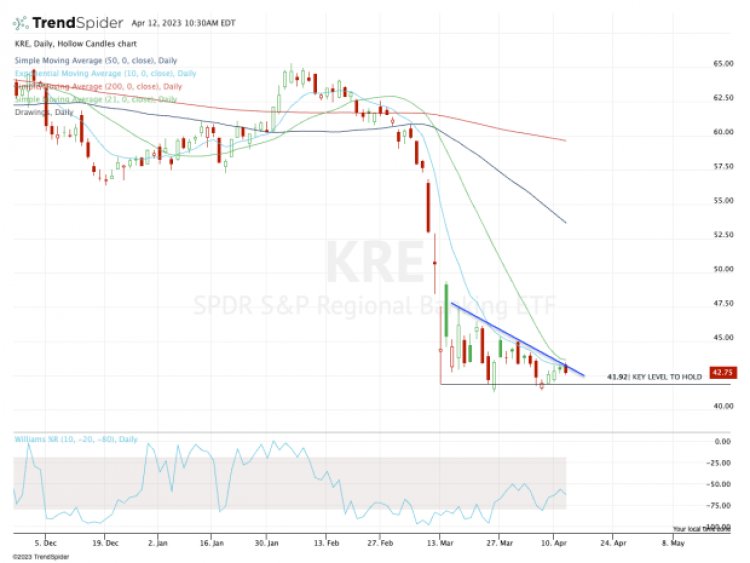
Trading the Regional Banking ETF
Chart courtesy of TrendSpider.com
The KRE ETF continues to make a series of lower highs, which is a bearish technical development. It’s also struggling to regain its 10-day moving average, which gives a good indication of short-term momentum.
For now, it continues to hold that very key $42 area, but this level has already played a significant role as support three times now. How many times can the bulls lean on this level before it breaks?
Don't Miss: Here's How Netflix Stock Can Rejoin the Nasdaq Party
From a technical perspective, the setup is relatively simple.
First, the bulls need the KRE ETF to continue holding $42 and, ideally, break above the 10-day and 21-day moving averages. If it can do that, then regaining $45 is the next step to repairing this chart, potentially opening the door back up to $50 or higher.
On the downside, a close below $42 and hitting new lows doesn’t give investors much of a reason to be long. Ultimately, it could open the door down to $38. Chart courtesy of TrendSpider.com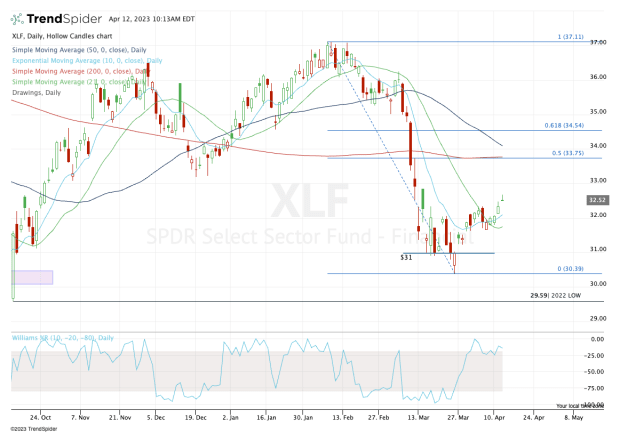
If we contrast the KRE ETF chart with the Financial Select Sector SPDR Fund (XLF) - Get Free Report chart, you’ll notice some big differences.
Notice how the XLF stock has regained both its 10-day and 21-day moving averages and continues to make higher highs off the low.
That doesn’t necessarily mean it will continue higher once earnings roll around, but the technicals are much healthier for the XLF than the KRE at this moment.
If the XLF does continue higher, the $33.75 to $34 area is a reasonable upside target for the bulls. If it declines, the bulls want to see it hold $31.50.
Action Alerts PLUS offers expert portfolio guidance to help you make informed investing decisions. Sign up now.
What's Your Reaction?