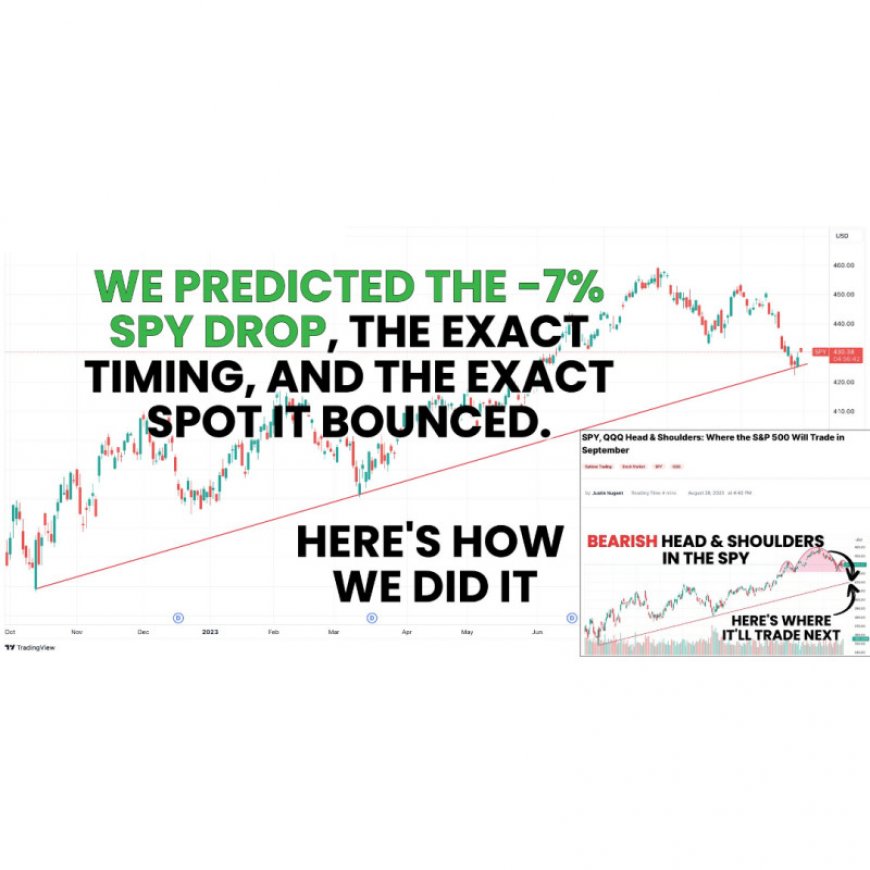
We Predicted the -7% SPY Drop to the Penny, AND the Bounce. Here’s How.
Here’s how we predicted an incredible SPY trading opportunity, no crystal ball required.
So, how did we do it? Two words: Technical analysis. For investors, fundamental analysis is extremely important. For traders, there is nothing more important than technical analysis in making accurate market predictions. Bold statement, we know — but it’s the truth. Technical analysis is at the backbone of every prediction we make. Every trade idea, whether it’s based on unusual options activity or something else we’re seeing in the market, is based on technical analysis. Let’s dig through the simple set of strategies we used to predict this large move that took the S&P 500 from its 52 week high lower by 7%, including how we spotted the exact level the drop would end, and even the date.
Retrospect: The Prediction
Throughout the first half of 2022, we’ve been extremely bullish on the market. We predicted the bottom of the regional banking crisis (including the exact date of the bottom), using call options to trade it. We traded Netflix from the mid $300’s up through the $400’s using technical analysis and call options. We called the May Nvidia earnings pump — the third largest daily gain in market cap in stock market history. There were several other examples, but you get the point: We were bullish, and we were showing that with our trades. However, in August, something important happened that gave us reason to think the market was in for a pause.
Predicting the Pullback in August
It all started in August when we identified weekly bearish engulfing candles in three indices.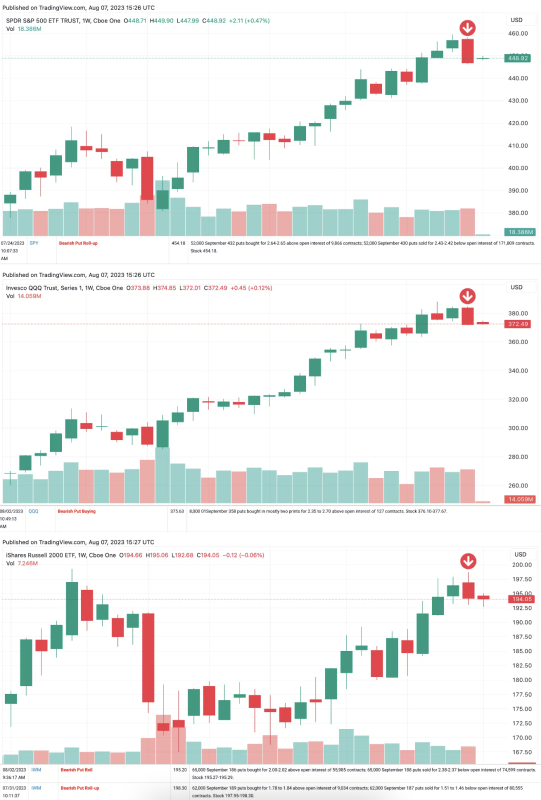
In this screenshot from an article we put out on August 8th, we identify a series of bearish unusual options activity in the IWM, the SPY, and the QQQ, paired with bearish technical patterns in each major ETF. A bearish engulfing candle is a two candle reversal pattern in which the second candle’s body extends above the top and below the bottom of the first candle’s body, and is a different color from the first candle. In this case, the first candle was green, and the second larger candle was red. This indicates a bearish reversal incoming. That’s exactly what we got.
On top of that, we identified a break in a short-term uptrend here: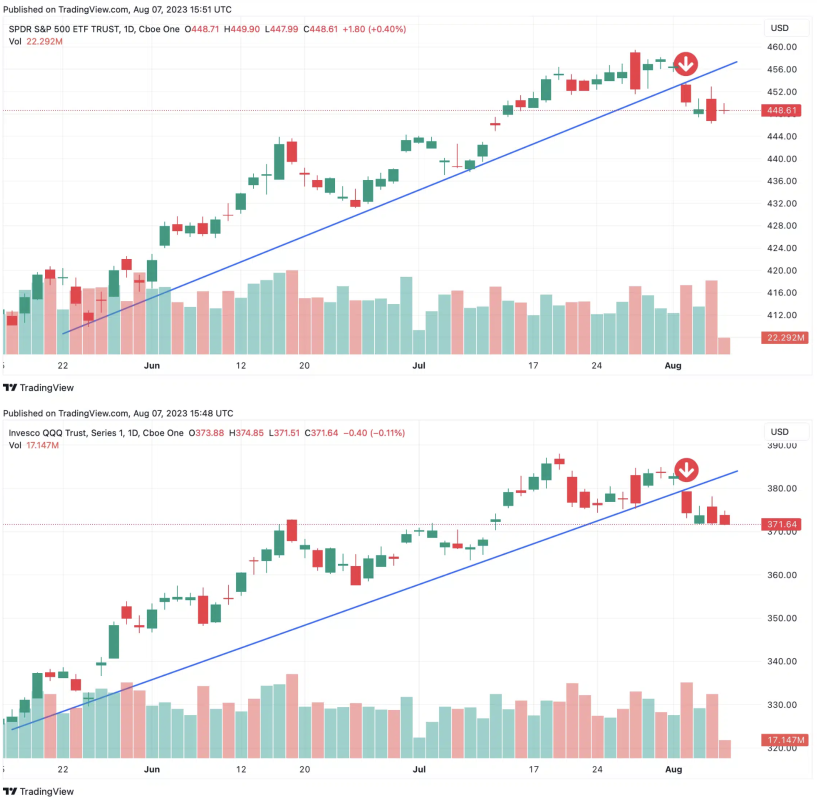
Seeing a confluence of factors like this is extremely rare, and when you see it, you must consider striking. That’s exactly what we did.
From here, stocks did exactly what we predicted: They fell throughout August. But we knew it wasn’t over.
Prediction the September Pullback
Remember that old phrase, “the trend is your friend.” It’s extremely important as a trader, and it isn’t just about present trends in price action. You can also use it to predict historical trends. Early in September, we continuously talked about the likelihood of weakness in September. Why? Simple: It’s the weakest month of the year. Entering the month from a weak position means we were likely in for more pain. Here’s the average for September: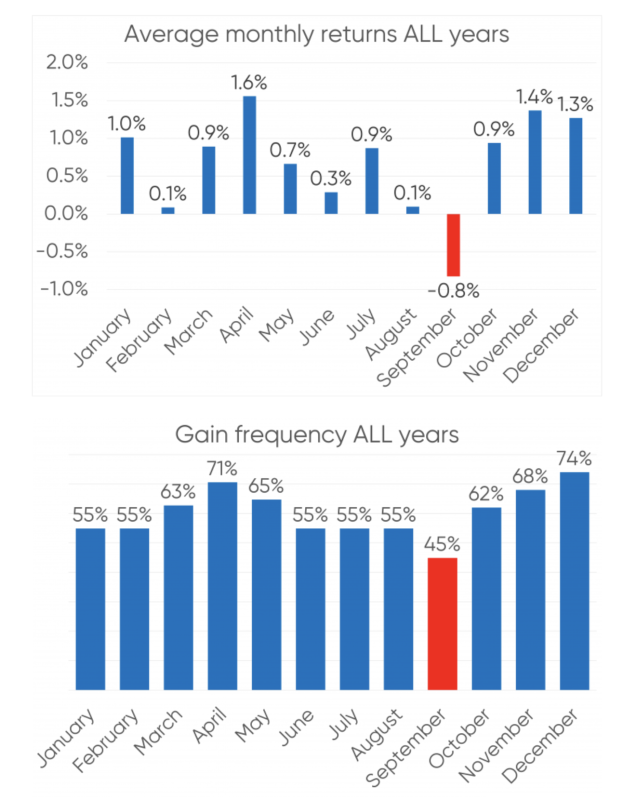
On top of this, yet again, we identified another bearish technical pattern: A notable head and shoulders in the SPY and the QQQ. From there, we charted a key trendline extending from the October lows, touching the March 2023 lows. We were confident from here predicting that the SPY ETF was going to retest this trendline.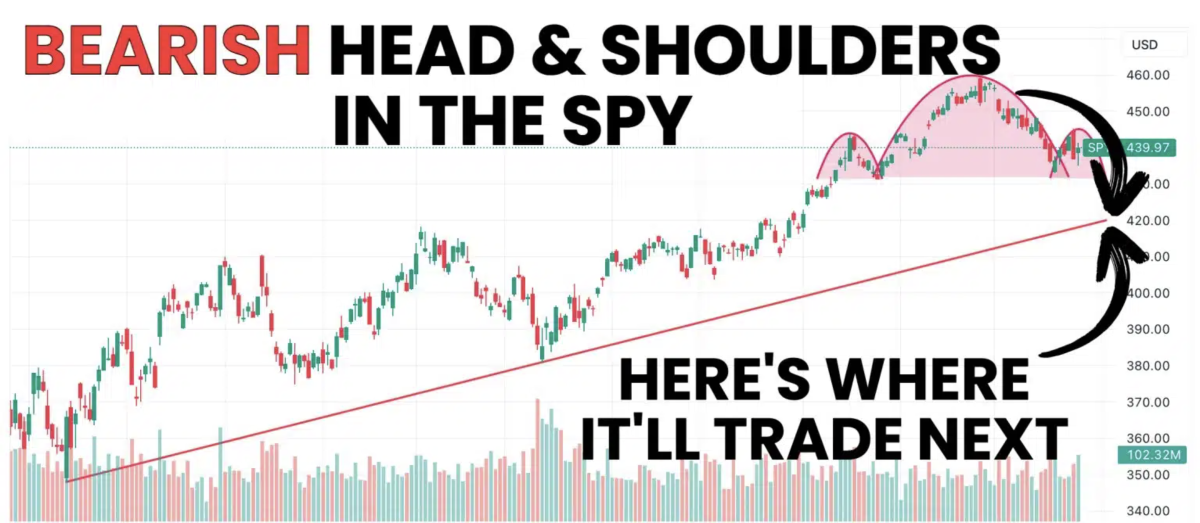
We continued to represent this viewpoint throughout the month, particularly here in this article we put out right before the worst two-week period of the year, where we identified that the pullback would likely take place during this exact period. We even identified one more bearish technical pattern that confirmed our view: A false breakout.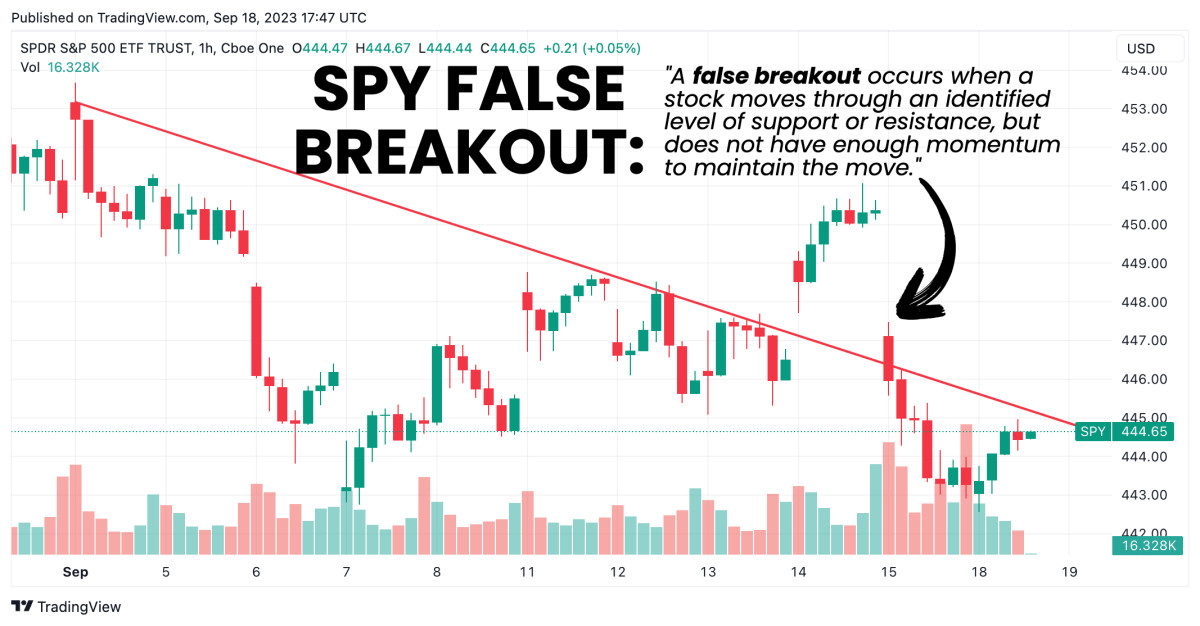
Further, we continued to represent that viewpoint here on Twitter: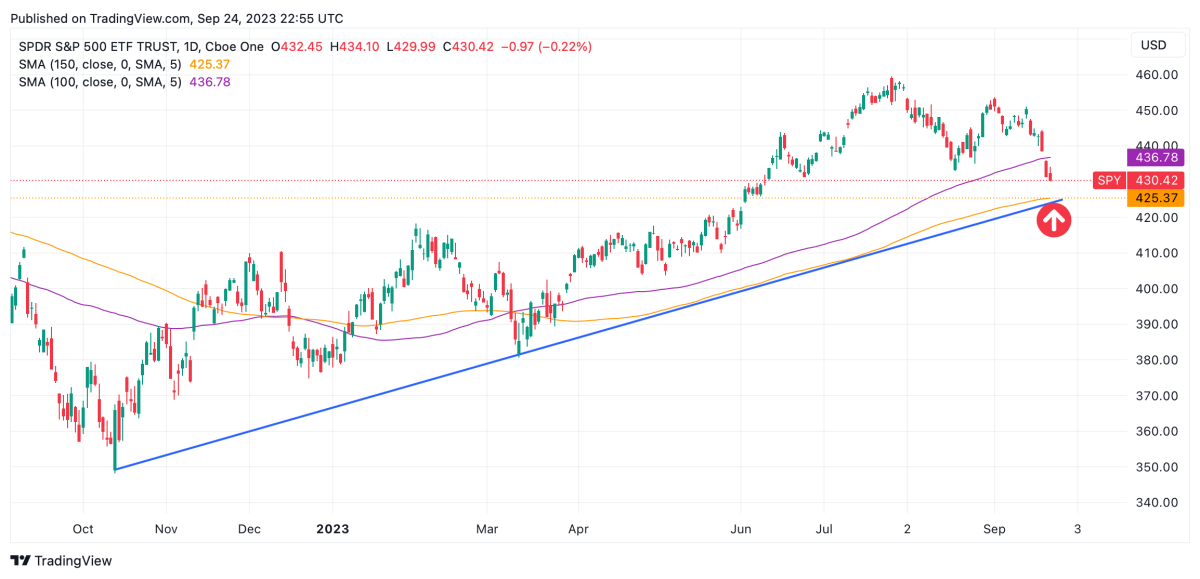
You know what happened next.
Predicting the SPY Bounce
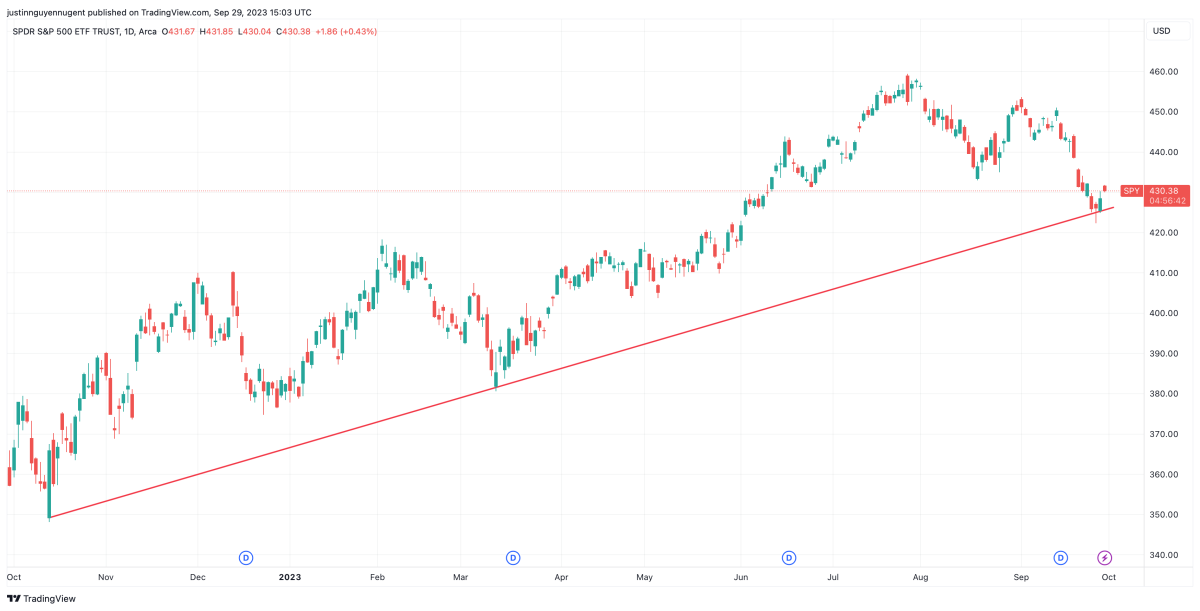
The SPY ultimately stopped and reversed directly on our trendline. Using put options, a trader could have capitalized on the move from August 8th to present, and known exactly when to cut their trade. And here’s the best part: It didn’t take a crystal ball, or even a CMT license to do it. It just took a little simple technical analysis, knowledge of how to craft a trendline, and an understanding of how to spot a bearish engulfing candle. Even though these are easy enough to spot, they do take practice to identify, and that’s exactly what we encourage at Market Rebellion.
Here’s the best part: It isn’t over.
Where the SPY Will Trade Next
From here, it’s likely that we retest the trendline at least one more time from here before the SPY makes a decisive move. That means you can still trade around this trendline. Here’s how:
If the SPY retests the line, and then makes a daily close above the trendline, that would be a bullish retest. From there, you can use this gap in the SPY as a nearby bullish trade target: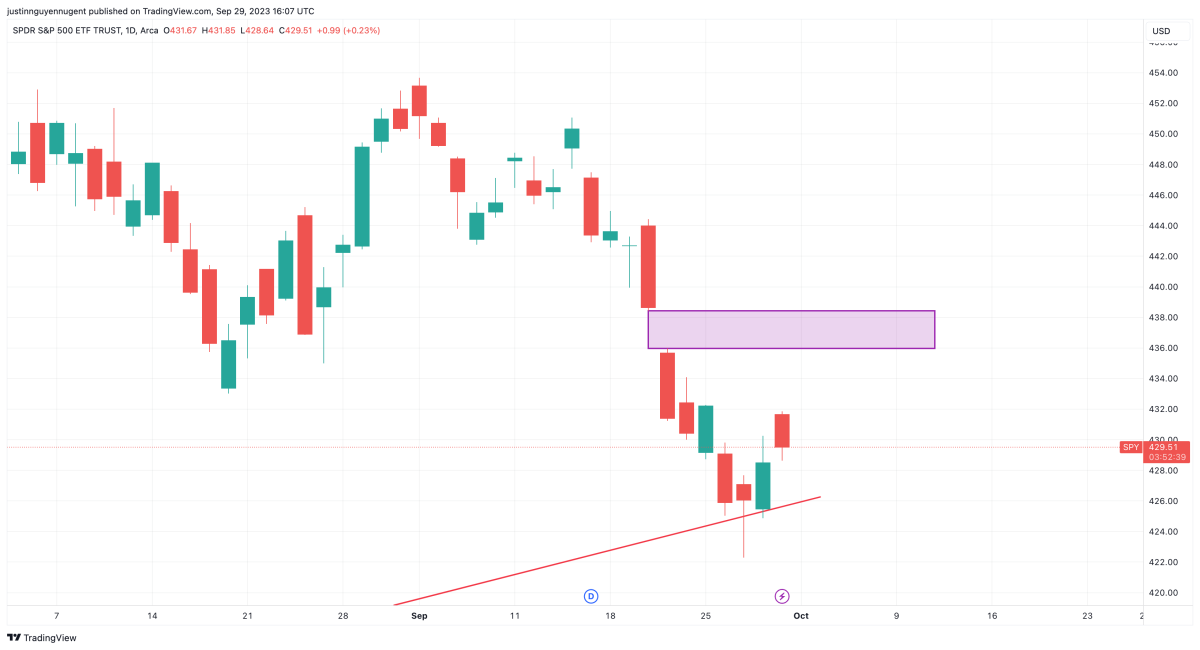
However, there’s a flipside to this coin. If the SPY retests the trendline and fails to bounce there, we’re looking at a lower target: The 200 day moving average, which can be used as a short-term bearish trading target.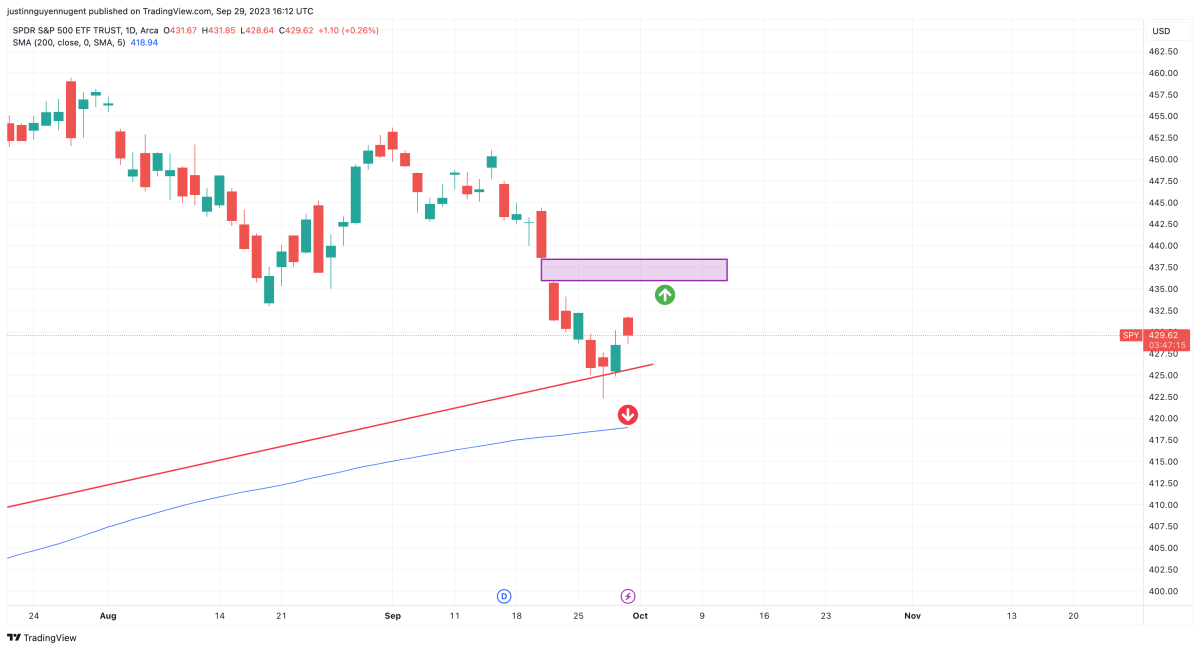
While these may seem like small moves to trade off of, marking levels like this allows us to be more precise with our trades, and using options allows these moves to still net us sizeable trades when they work out.
Interested in seeing how we use unusual options activity (like the trades we used above to form part of our bearish thesis) combined with technical analysis to make trades like these every week? Check out our free webinar this Tuesday at 4PM market close to discover how CMT Ryan Mastro does it! Sign up here.
What's Your Reaction?