Best Buy Rallies on Earnings, but Chart Hints at Caution
Best Buy stock is rallying hard on earnings, but is approaching a key resistance level. Here's what to watch for now.
Best Buy stock is rallying hard on earnings, but is approaching a key resistance level. Here's what to watch for now.
Shares of Best Buy (BBY) - Get Free Report are enjoying some time in the sun on Tuesday, with shares up more than 11% so far on the day.
The rally comes after the retailer delivered a better-than-expected earnings result. That’s even as earnings fell 33% and revenue dropped 11% year over year. However, both figures topped analysts’ expectations.
More importantly, guidance was a bit stronger than analysts had expected, particularly on the same-store sales metric.
Further, the company said that it resumed its share repurchase program this month after pausing it in the second quarter. Management plans to buy back roughly $1 billion worth of stock this year.
The retail sector has reported pretty good results, for the most part. Dollar Tree (DLTR) - Get Free Report is down about 10% today on disappointing earnings, while Target (TGT) - Get Free Report fell hard last week.
However, many other retail stocks have had strong reactions to their respective earnings reports.
Trading Best Buy Stock on Earnings
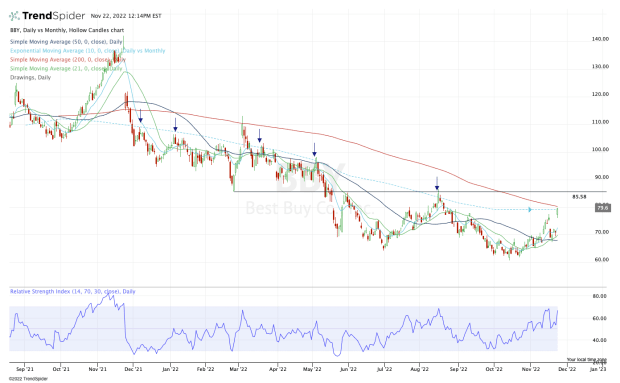
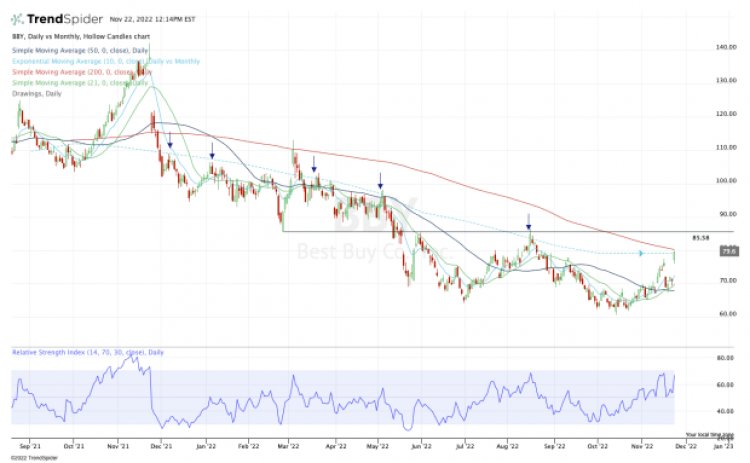
Chart courtesy of TrendSpider.com
Best Buy’s post-earnings rally is keeping that mostly-bullish theme alive for retail stocks. However, there is reason for some caution when we look at the charts.
When we look at the daily chart with the 10-month moving average overlaid on the chart, it’s clear where we spot potential trouble.
Near $80 we have the declining 10-month and 200-day moving averages. Best Buy stock hasn’t tested its 200-day moving average since March, when the measures harshly rejected the stock.
In the case of the 10-month moving average, this measure has been resistance many times over the past 12 months, as shown in the chart above.
However, where there’s a hurdle, there’s an opportunity.
If Best Buy stock is able to clear these two measures, it opens the door to the $85 to $86 area. This level was support in the first quarter and resistance in the second and third quarters of this year.
That said, if these measures — the 10-month and the 200-day moving averages — are resistance, keep an eye on $77.50 and $76.12. Those levels are last week’s high and today’s low, respectively.
If Best Buy stock trades back below those marks, it drastically increases the odds that the stock will go on to fill its earnings gap to $71.50. At the very least, it may decline down to its 10-day moving average.
Somewhere in this area — between the 10-day and the gap-fill — bulls will be looking for the stock to find support.
What's Your Reaction?