Here’s When to Buy Microsoft Stock (Again)
Microsoft stock is back under pressure as the market is selling off. Here's where to look for support.
Microsoft stock is back under pressure as the market is selling off. Here's where to look for support.
After a big bounce earlier this quarter, Microsoft (MSFT) - Get Free Report has not been trading all that well over the past few weeks.
The stock has now declined in two straight weeks, and after the Fed reaffirmed a hawkish rate stance last week, tech once again looks weak.
There’s always a chance that buyers will step in to prevent the software stalwart from making new 52-week lows. But selling pressure in the broad market could keep Microsoft under the sellers' control.
Microsoft is a great company. It has an excellent combination of profitability, growth, balance sheet power and valuation. But while it may be a great long-term hold, it’s still susceptible to the temperament of the overall market.
Tech broadly is under pressure, and when investors sell in droves, the funds and ETFs are forced to sell across the board, too, which weighs on Microsoft.
Microsoft stock has suffered a peak-to-trough decline of 39%, its worst fall in 12 years.
Let's review the chart.
When to Buy Microsoft Stock
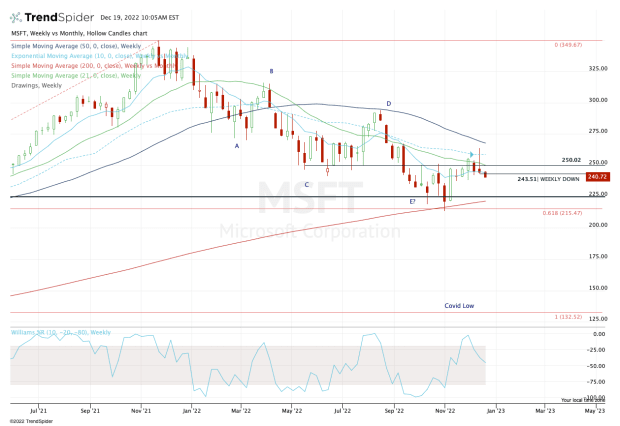
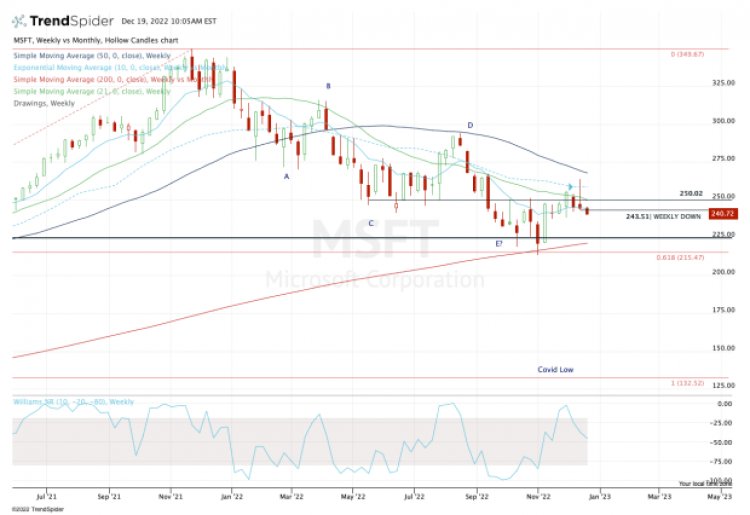
Chart courtesy of TrendSpider.com
As you can see on the weekly chart above, the stock had a very orderly correction down to the $215 to $225 area.
This was a major zone to buy for several reasons, including the 200-week moving average, 61.8% retracement and the prior breakout zone.
Upon the stock’s first test of this area, we had a big reaction to the upside, which quickly sent Microsoft stock toward $250 and eventually to a high of roughly $264.
Amid this rally, the shares were finding support at the 10-week moving average. But they're now breaking below this measure as well as rotating below last week’s low of $243.51.
Now that the stock is firmly in a “weekly down” state, the bulls are wondering where support may come into play. While there is some support in the $240 area, my attention is a bit lower.
While hidden on the weekly chart, there's a fairly notable gap-fill level down at $228.63.
Below that and the $225 breakout area and the 200-week moving average could be back in play, followed by a retest of the 52-week low at $213.43.
Obviously no one knows how low a stock could fall before it ultimately bottoms.
But this is a high-quality stock with a high-quality business that doesn’t tend to go on a “40% off sale” all that often.
When it does, traders should pay attention and use levels to navigate their approach.
What's Your Reaction?