Did Amazon Stock Bottom in 2022 or Are More Losses on the Way?
Amazon stock is down 50% so far on the year. The stock must hold key support.
Amazon stock is down 50% so far on the year. The stock must hold key support.
Amazon (AMZN) - Get Free Report stock was not the worst-performing FAANG stock in 2022, but it was far from the best.
Amazon's seemingly strong and resilient business in the cloud with Amazon Web Services is showing some cracks, while its retail business has been prone to rising inventory and transportation costs, alongside fluctuations in consumer spending.
As other retailers have struggled this year, so has Amazon.
Although Amazon stock has performed better than Netflix (NFLX) - Get Free Report and Meta (META) - Get Free Report this year, its 50% year-to-date loss does little to impress the bulls.
The question becomes: Has the stock bottomed or will there be more pain in 2023?
Trading Amazon Stock
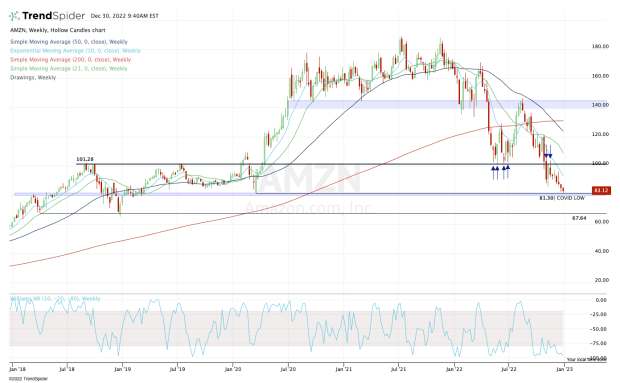
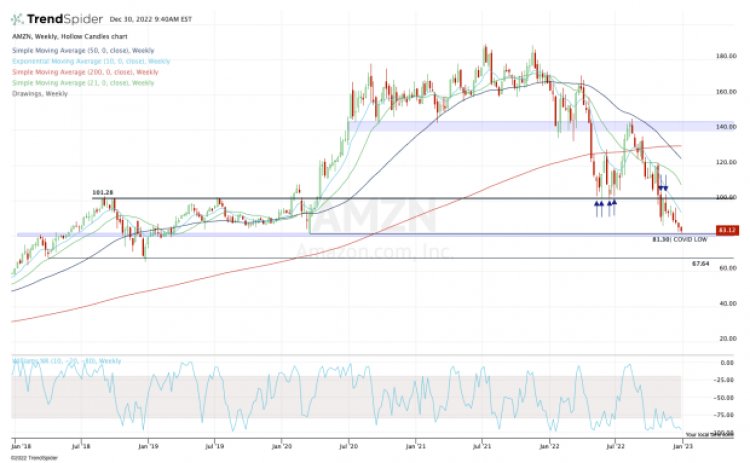
Chart courtesy of TrendSpider.com
Amazon stock is set for its fourth straight weekly decline and earlier this week made 52-week lows. So did Apple (AAPL) - Get Free Report, as most of the FAANG stocks continue to struggle (except Netflix).
That said, Amazon stock is trading into an area of significance on the weekly chart. Not only is the covid low in play at $81.30, but if we look back all the way through 2018, one can see that this area has been significant support over the years.
Already down about 55% from the all-time high, some investors may believe that the worst is over.
I’m not a doom-and-gloom type of person, but the charts don’t lie. Right now, Amazon has seen prior support turn into current resistance — most notably at $100 — while the active trend remains bearish.
Those observations will change at some point, but not just yet.
With that in mind, I would keep a close eye on the $80 area. If that holds as support, Amazon stock could see a decent rebound, first putting the declining 10-week moving average in play (which is active resistance). That’s followed by a possible rally to the $100 area.
However, should $80 fail as support, then the $72 to $73 area stands as a possible landing spot. That’s the 61.8% retracement of the stock’s entire trading range and the 161.8% downside extension of the current range.
Lastly, the $67.50 area stands out as notable support. That would represent a 19% decline from current levels and equate to a 64.1% decline from the all-time high.
For now, though, let’s see how the low-$80s do as support.
What's Your Reaction?