Too Early to Buy AMD? Charts Provide Clues for Traders.
AMD stock filled the gap and is trying to find support. Here is the trade now.
AMD stock filled the gap and is trying to find support. Here is the trade now.
Shares of Advanced Micro Devices (AMD) - Get Free Report have been struggling, and the bulls are hoping the stock soon finds its footing.
The shares are down four weeks in a row, a streak AMD stock can snap with a 2.4% rally on Friday.
On Thursday, the stock was down 8% at one point and closed lower by 5.6%. The earnings reaction from Micron (MU) - Get Free Report didn’t seem to help matters, nor did the broader market decline.
A few observations regarding AMD:
-- Tech stocks remain in a bear market, with each rally being sold.
-- AMD continues to lag Nvidia (NVDA) - Get Free Report when it comes to stock performance.
-- The Fed is leading the hawkish chorus among global central banks, as they continue to tighten their policies. That’s not only negative for stocks but seems likely to be pushing us toward a recession.
None of those observations are bullish for AMD stock, even if the shares are becoming attractive on a valuation basis.
Trading AMD Stock
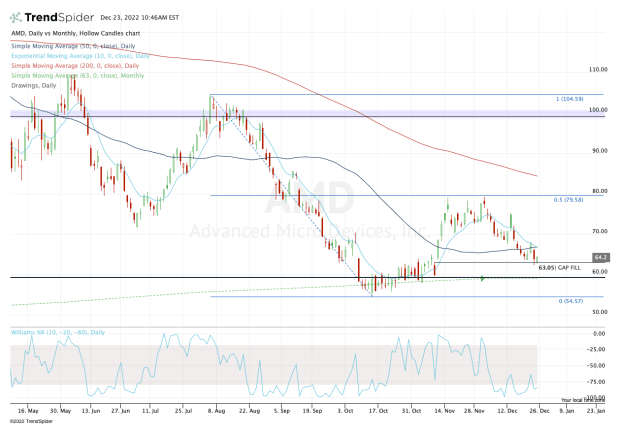
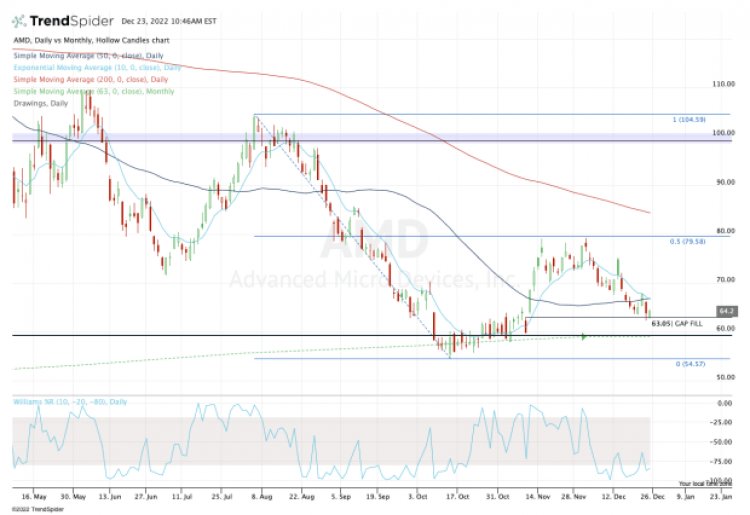
Chart courtesy of TrendSpider.com
The stock at one point lost nearly half its value, dropping to $55 from $105. It found support just below the prior breakout level at $59 and the 21-quarter moving average.
With yesterday’s flush, AMD stock filled the gap at $63 and found support near the 61.8% retracement. Now it’s once again trying to find its footing, and the bulls are hopeful for a bounce.
They may get one, but until AMD stock can clear the 10-day and 50-day moving averages, it may be nothing more than that — a bounce.
Currently, AMD stock doesn’t appear able to sustain an uptrend until it reclaims those key measures.
If it can clear those levels and close above the $70 to $72 area, then $80 is back in play, along with the 200-day moving average. Chart courtesy of TrendSpider.com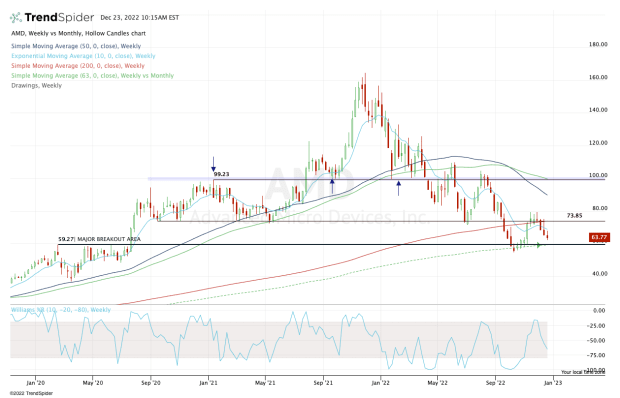
Longer term, the trend still looks precarious for the bulls.
The shares momentarily reclaimed the $73 to $74 area, which was previous support over the past several years.
While the daily chart is more nuanced than the weekly, the latter seems to suggest another test of the $59 area and the 21-quarter moving average.
If selling pressure persists, the low near $54.50 is likely in play, followed by $50.
What's Your Reaction?