When to Buy Nordstrom Stock After Mixed Earnings and Technicals
Nordstrom stock is rallying hard off the low but is still down after a mixed earnings report. The charts are mixed, too. Here's clarity.
Nordstrom stock is rallying hard off the low but is still down after a mixed earnings report. The charts are mixed, too. Here's clarity.
Shares of Nordstrom (JWN) - Get Free Report are down about 4% at last check. They were down nearly 10% after the retailer reported third-quarter earnings.
It was a mixed result, as sales and earnings slipped 2.5% and 48%, respectively, but both metrics beat estimates.
Wall Street wasn’t willing to give the stock a free pass though, as the outlook disappointed investors.
While the management still expects full-year revenue growth between 5% and 7%, it cut the outlook for adjusted profit. Instead, management now sees earnings between $2.13 and $2.43 a share vs. a prior outlook of $2.45 to $2.75 a share.
We’ve seen a number of retailers report strong results so far this quarter, so to see Nordstrom disappoint is a bit surprising.
That said, Macy’s (M) - Get Free Report, Best Buy (BBY) - Get Free Report, Walmart (WMT) - Get Free Report and others continue to trade well after they reported earnings. Can Nordstrom get back on track?
Trading Nordstrom Stock on Earnings
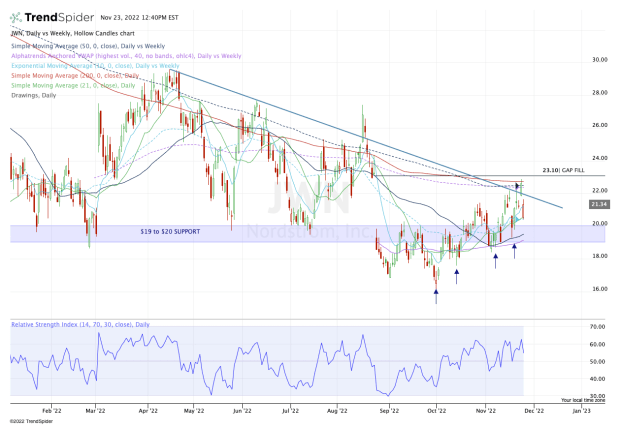
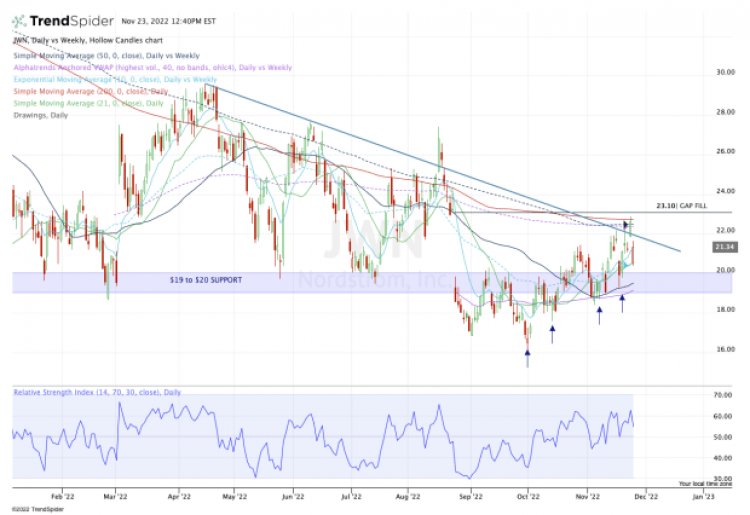
Chart courtesy of TrendSpider.com
“Muddy.”
It’s the word that first comes to mind when I look at the daily chart for Nordstrom stock.
The stock’s rally on Tuesday propelled it 6.5% higher in anticipation of a strong result today. That’s not the case, although the stock has only given up part of its gains from that rally, holding above Monday’s closing price.
Regardless, the shares were rejected from a key area on the chart as they ran right into the 200-day and 50-week moving averages, as well as the weekly VWAP measure. It also ran right into downtrend resistance (blue line).
On the downside, it’s holding the 10-day, 10-week and 21-day moving averages as support. You get the picture — "muddy."
Bulls who feel as if they must be long Nordstrom can do so against today’s low of $20.40.
A break of that mark puts Nordstrom stock below all the measures listed above and thrusts the daily VWAP measure and the 50-day moving average into the spotlight. It also puts the $19 to $20 support zone to test.
If it fails, $18 or lower could be in play.
Alternatively, bulls could wait for Nordstrom stock to clear and close above $23.10 — the gap-fill from August — before going long.
While that will leave them with a higher cost basis, they will also have far more clarity if the stock can clear resistance. Until then, they can always trade the other stocks above, as the charts are clearer at this moment.
What's Your Reaction?