How to track stocks in a spreadsheet with Google Finance
You already use Google for everything else — Google Finance can track your portfolio in a tidy, shareable, and downloadable spreadsheet.

Tracking stock prices is easy using Google Finance.
Your Google Finance watchlist provides real-time stock market quotes, plus data and analytics about international markets and finance. It's a treasure trove of information, available for free to anyone. In addition, you can start to gather, track, and customize all that data using Google Sheets. Just follow these step-by-step instructions to pull stock data via Google Finance.
The spreadsheet version of the following tutorial can be downloaded here. Make a copy of the worksheet by selecting "Make a copy" from the drop-down in the File menu.
What is Google Finance?
Google Finance is a tool created by Google’s parent company Alphabet Inc. (GOOG). It allows Google users to download financial data about stocks, bonds, mutual funds, indexes, currency, and cryptocurrency exchange rates onto Google Sheets.
Google pulls its data from various sources, including exchanges in the U.S. and globally, and content providers such as S&P Capital IQ. Google Finance has fixed fields for label attributes that download specific types of data, like price (which is the latest price available), close, volume, and market capitalization.
Inputting specific attributes onto Sheets allows you to create a customized spreadsheet. You can track a publicly traded company’s stock price over a period of days, weeks, months, or years. Shutterstock
How to create a spreadsheet tracking a stock using Google Sheets
You must have a Google account to access Google Sheets. Type sheets.new into your browser or create a new spreadsheet in your Google account. Google has a formula that allows you to download data from your Google Finance watchlist onto a spreadsheet, and this can be accomplished by following these steps. These examples use Elon Musk's electric vehicle company Tesla TSLA.
Understanding Google Finance’s formula
Google Finance’s formula for pulling up historical data on a particular stock is set up as an equation with different fields. Its syntax follows:
=GOOGLEFINANCE(ticker, [attribute], [start_date], [end_date|num_days], [interval])
Ticker
This field must include the exchange followed by a colon and ticker symbol (no spaces).
Attribute
This field is a particular entry of a company’s stock action. It can range from price to close to 52-week high and low.
Start_date
This represents the first day of the attribute.
End_date or number of days
This represents the last day of the attribute. Number of days including the start date can be entered in lieu of the end date.
Interval
This signifies the frequency of the attribute. Google Finance only allows daily or weekly results, none (as of now) on a monthly or yearly basis.
How to download your portfolio using Google Finance
There are two ways to download the data: a direct way by inputting the fields directly into the formula, and an indirect way in which defined cells populate the formula.
Direct way
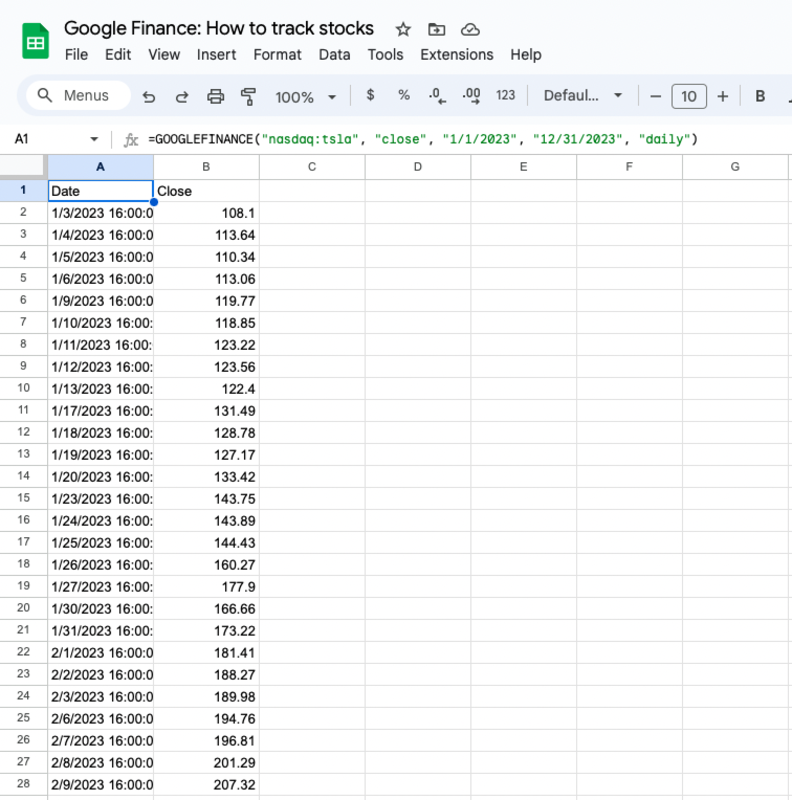
The direct way is to input the entries in the fields of the formula, in either the formula bar or in the cell. For example, to get the closing stock prices of Tesla on a daily basis in 2023, the formula would appear as such:
=GOOGLEFINANCE("nasdaq:tsla", "close", "1/1/2023", "12/31/2023", "daily")
The result lists the historical data for the selected date range. Using the first day and last day of the calendar year automatically enters the first day of trading and the latest or last day of trading.
Google recommends using the symbol of an exchange preceding a company's ticker symbol, most likely to avoid conflicting with the use of a ticker symbol on another exchange in its list of available exchange data. However, only entering the ticker symbol will work in the formula.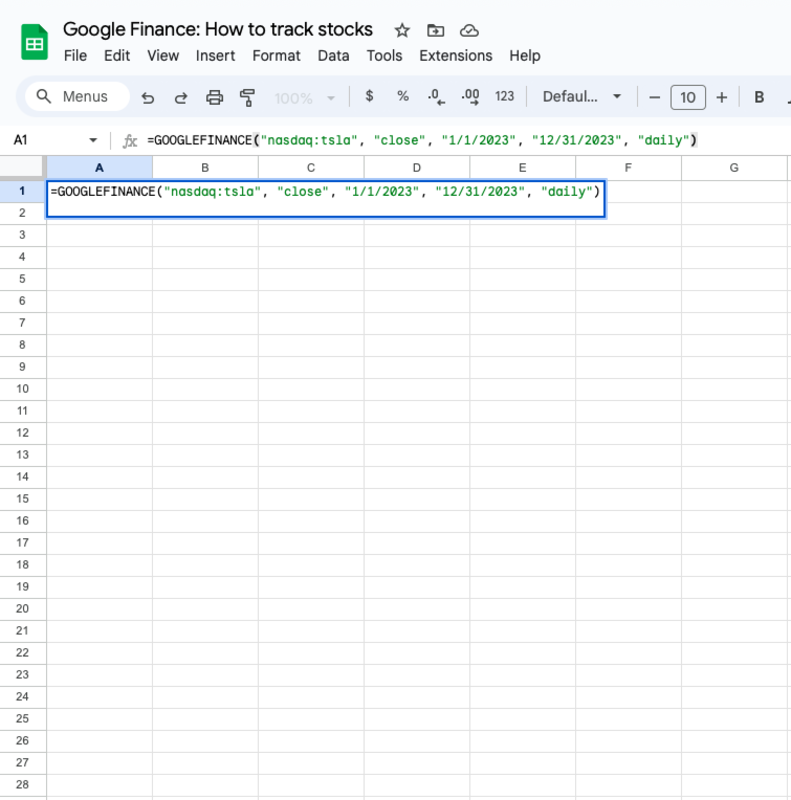
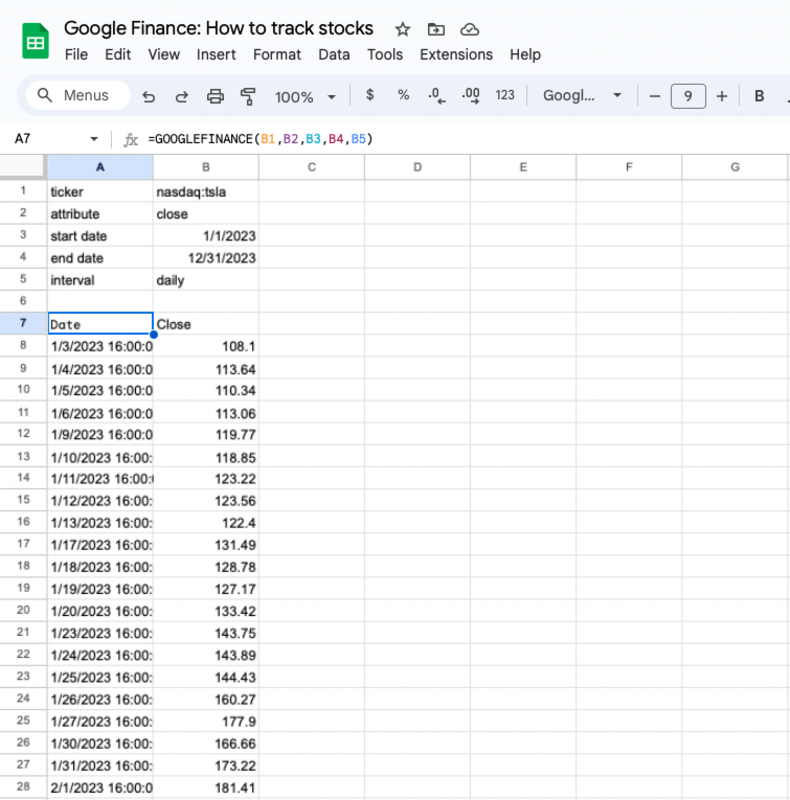
Indirect way
The indirect way is to create a table on Google Sheets and replace the fields in the formulas with cells that correspond to those fields, as shown in the example below. Column A will describe what fields need to be filled in Column B. In a separate cell, the formula is filled out with the fields corresponding to those cells, resulting in the historical data for the selected date range.
For example, using the same formula for pulling up the historical table, it would be written as such:
=GOOGLEFINANCE(B1,B2,B3,B4,B5)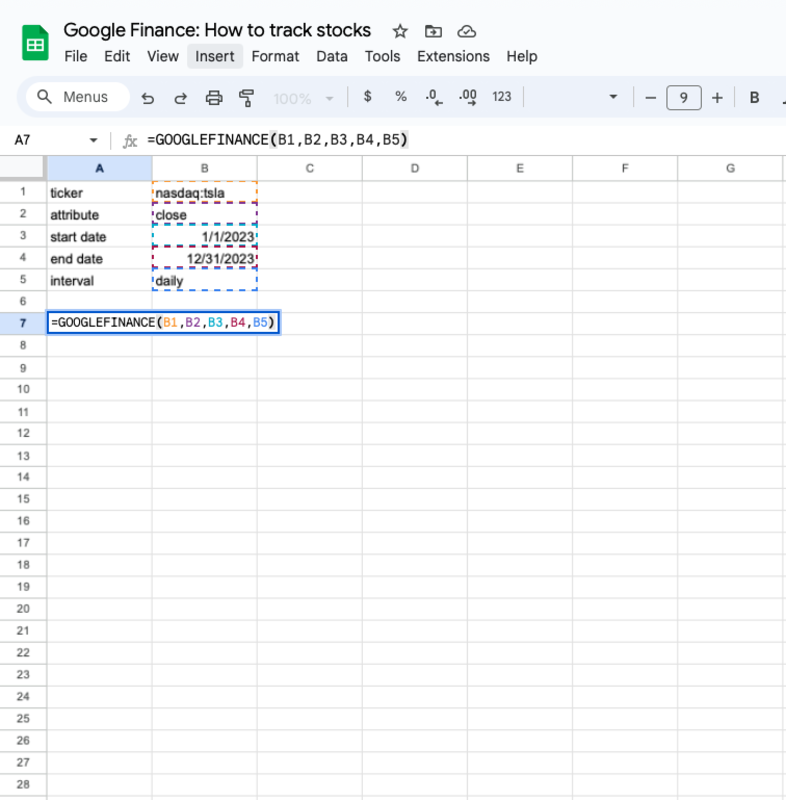
Again, the Google spreadsheet can be downloaded here. Make a copy of the worksheet by selecting "Make a copy" from the drop-down in the File menu.
This is just the first of many articles about how to use tools in Google Sheets. Let us know what you'd like to see next. Email us here: [email protected]
What's Your Reaction?